We use cookies to improve your browsing experience. Necessary cookies are required to support essential features of the Council's website. Optional cookies help us produce anonymous and aggregated statistical reports to better serve your needs.

Visit our cookies policy page for more information and to change your settings.

български español čeština dansk Deutsch eesti Ελληνικά English français Gaeilge hrvatski italiano latviešu lietuvių magyar Malti Nederlands polski português română slovenčina slovenščina suomi svenska
Skip to content
Page is loading

Infographics

Infographics

The image shows the European Union flag on the left and a blue silhouette of the Western Balkans region on the right, connected by two red arrows forming a circular flow, symbolising interaction or integration between the EU and the Western Balkans.

02/06/2026

EU-Western Balkans investment and trade

The infographic presents EU-Brazil trade relations, providing main facts and figures on trade in goods, trade in services and foreign direct investment.

12/05/2026

EU-Brazil trade: facts and figures

Abstract collage of the flags of the Mercosur countries and the EU, illustrating trade.

01/05/2026

EU-Mercosur trade: facts and figures

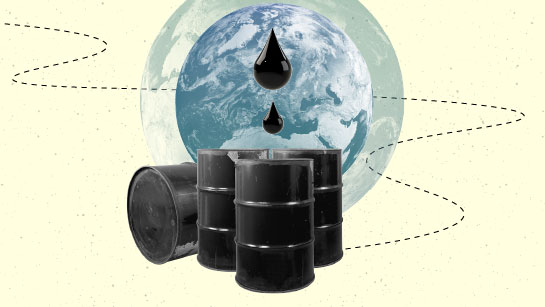
Collage with black oil barrels and large drops of oil in front of an image of the Earth.

07/04/2026

Where does the EU get its oil from?

A stylised graphic showing two-way trade between Australia and the European Union, with arrows and flags linking a map of Australia to a map of Europe.

24/03/2026

EU-Australia trade: facts and figures

The infographic explains from what sources electricity is produced in the EU and how its price is set.

06/03/2026

How is EU electricity produced and sold?

The infographic provides recent data about the EU's gas supply.

02/03/2026

Where does the EU's gas come from?

A collage of green and blue geometric patterns with stars, rays, and rectangles that overlap, representing the EU and the AU flags. The collage also features containers to symbolise trade relations.

11/02/2026

EU-Africa trade: facts and figures

An illustration of a mobile phone displaying an online shopping interface with a grey jumper and a shopping cart icon. Gold and blue coins are scattered in the background, symbolising e-commerce or online transactions.

15/12/2025

E-commerce in the EU

Globe with the EU highlighted in blue and South Africa in red.

25/11/2025

EU-South Africa trade

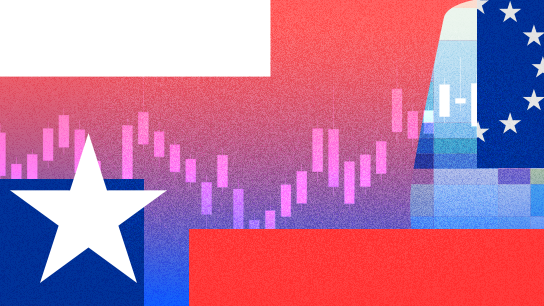
Trade relations between the European Union and Chile.

24/11/2025

EU-Chile trade relations: facts and figures

15/11/2025

2026 EU budget: main areas

Illustrated map of the globe. The region of Latin America and the Caribbean is highlighted in green, and the EU region is marked in blue. In the lower left corner there is CELAC logo and in the upper right corner there is the EU flag.

04/11/2025

EU-CELAC relations: facts and figures

Abstract shapes including elements of the EU flag and of the logo of ASEAN.

29/10/2025

EU-ASEAN trade

Collage of three people: a blind man with a dog, woman in a wheelchair and a boy with mobility issues using a support to move.

14/10/2025

Disability in the EU: facts and figures

Collage combining Indonesian temples and statues with shipping containers, and part of the European Union flag, symbolising trade relations between Indonesia and the EU.

30/09/2025

EU–Indonesia trade: facts and figures

Illustration of the battery supply chain

18/07/2025

Towards a sustainable, circular, European battery supply chain

The trade deal between EU and Japan is bringing benefits to EU citizens and companies

16/07/2025

EU-Japan trade: facts and figures